Reports
There are multiple outputs available in marathon for inspection after the test run. Let's check all of them.
Logs
Stdout log
The first and easiest one to is the stdout log that is printed during the execution of the test run. Enable debug mode via configuration to have more information to inspect.
foo@bar $ marathon
...

Device emulator-5554 connected. Healthy = true
Device Unknown booted!
Installing application output to emulator-5554
Installing application output to emulator-5556
Uninstalling com.example from emulator-5554

Run instrumentation tests /Users/xxx/Development/marathon/sample/android-app/app/build/outputs/apk/androidTest/debug/app-debug-androidTest.apk for app /Users/xxx/Development/marathon/sample/android-app/app/build/outputs/apk/debug/app-debug.apk
Output: /Users/xxx/Development/marathon/sample/android-app/app/build/reports/marathon/debugAndroidTest
Ignore failures: false
Scheduling 28 tests
com.example.ClassIgnoredTest#testAlwaysIgnored, com.example.FailedAssumptionTest#failedAssumptionTest, com.example.FailedAssumptionTest#ignoreTest, com.example.MainActivityFlakyTest#testTextFlaky, com.example.MainActivityFlakyTest#testTextFlaky1, com.example.MainActivityFlakyTest#testTextFlaky2, com.example.MainActivityFlakyTest#testTextFlaky3, com.example.MainActivityFlakyTest#testTextFlaky4, com.example.MainActivityFlakyTest#testTextFlaky5, com.example.MainActivityFlakyTest#testTextFlaky6, com.example.MainActivityFlakyTest#testTextFlaky7, com.example.MainActivityFlakyTest#testTextFlaky8, com.example.MainActivitySlowTest#testTextSlow, com.example.MainActivitySlowTest#testTextSlow1, com.example.MainActivitySlowTest#testTextSlow2, com.example.MainActivitySlowTest#testTextSlow3, com.example.MainActivitySlowTest#testTextSlow4, com.example.MainActivityTest#testText, com.example.MainActivityTest#testText1, com.example.MainActivityTest#testText2, com.example.MainActivityTest#testText3, com.example.MainActivityTest#testText4, com.example.MainActivityTest#testText5, com.example.MainActivityTest#testText6, com.example.MainActivityTest#testText7, com.example.MainActivityTest#testText8, com.example.MainActivityTest#testText9, com.example.ParameterizedTest#test
device emulator-5554 associated with poolId omni
pool actor omni is being created
add device emulator-5554
initialize emulator-5554

Installing com.example, /Users/xxx/Development/marathon/sample/android-app/app/build/outputs/apk/debug/app-debug.apk to emulator-5554
Success
Installing instrumentation package to emulator-5554
Uninstalling com.example.test from emulator-5554
Installing com.example.test, /Users/xxx/Development/marathon/sample/android-app/app/build/outputs/apk/androidTest/debug/app-debug-androidTest.apk to emulator-5554
Success
Prepare installation finished for emulator-5554
tests = []
Starting recording for ClassIgnoredTest.testAlwaysIgnored

....

terminate emulator-5554
Allure environment data saved.
Marathon run finished:
Device pool omni:
    23 passed, 2 failed, 3 ignored tests
    Flakiness overhead: 0ms
    Raw: 23 passed, 2 failed, 3 ignored, 0 incomplete tests
Total time: 0H 0m 57s
Raw json log
In case you want to produce a custom report, or you want to push metrics based on the results of the execution raw json is probably your best option. Each test is serialized as a json object inside an array. Keep in mind that this report shows retries, so you have full access to what happened during the execution.
This log file can be found at the $output/test_result/raw.json
{
  "package": "com.example",
  "class": "SomeTest",
  "method": "checkSomethingActuallyWorks",
  "deviceSerial": "XXXXXXXXXXXX",
  "ignored": false,
  "success": true,
  "timestamp": 1548142665055,
  "duration": 13370
}
Visual Reports
Html report
This report can be found at $output/html/index.html
Demos:
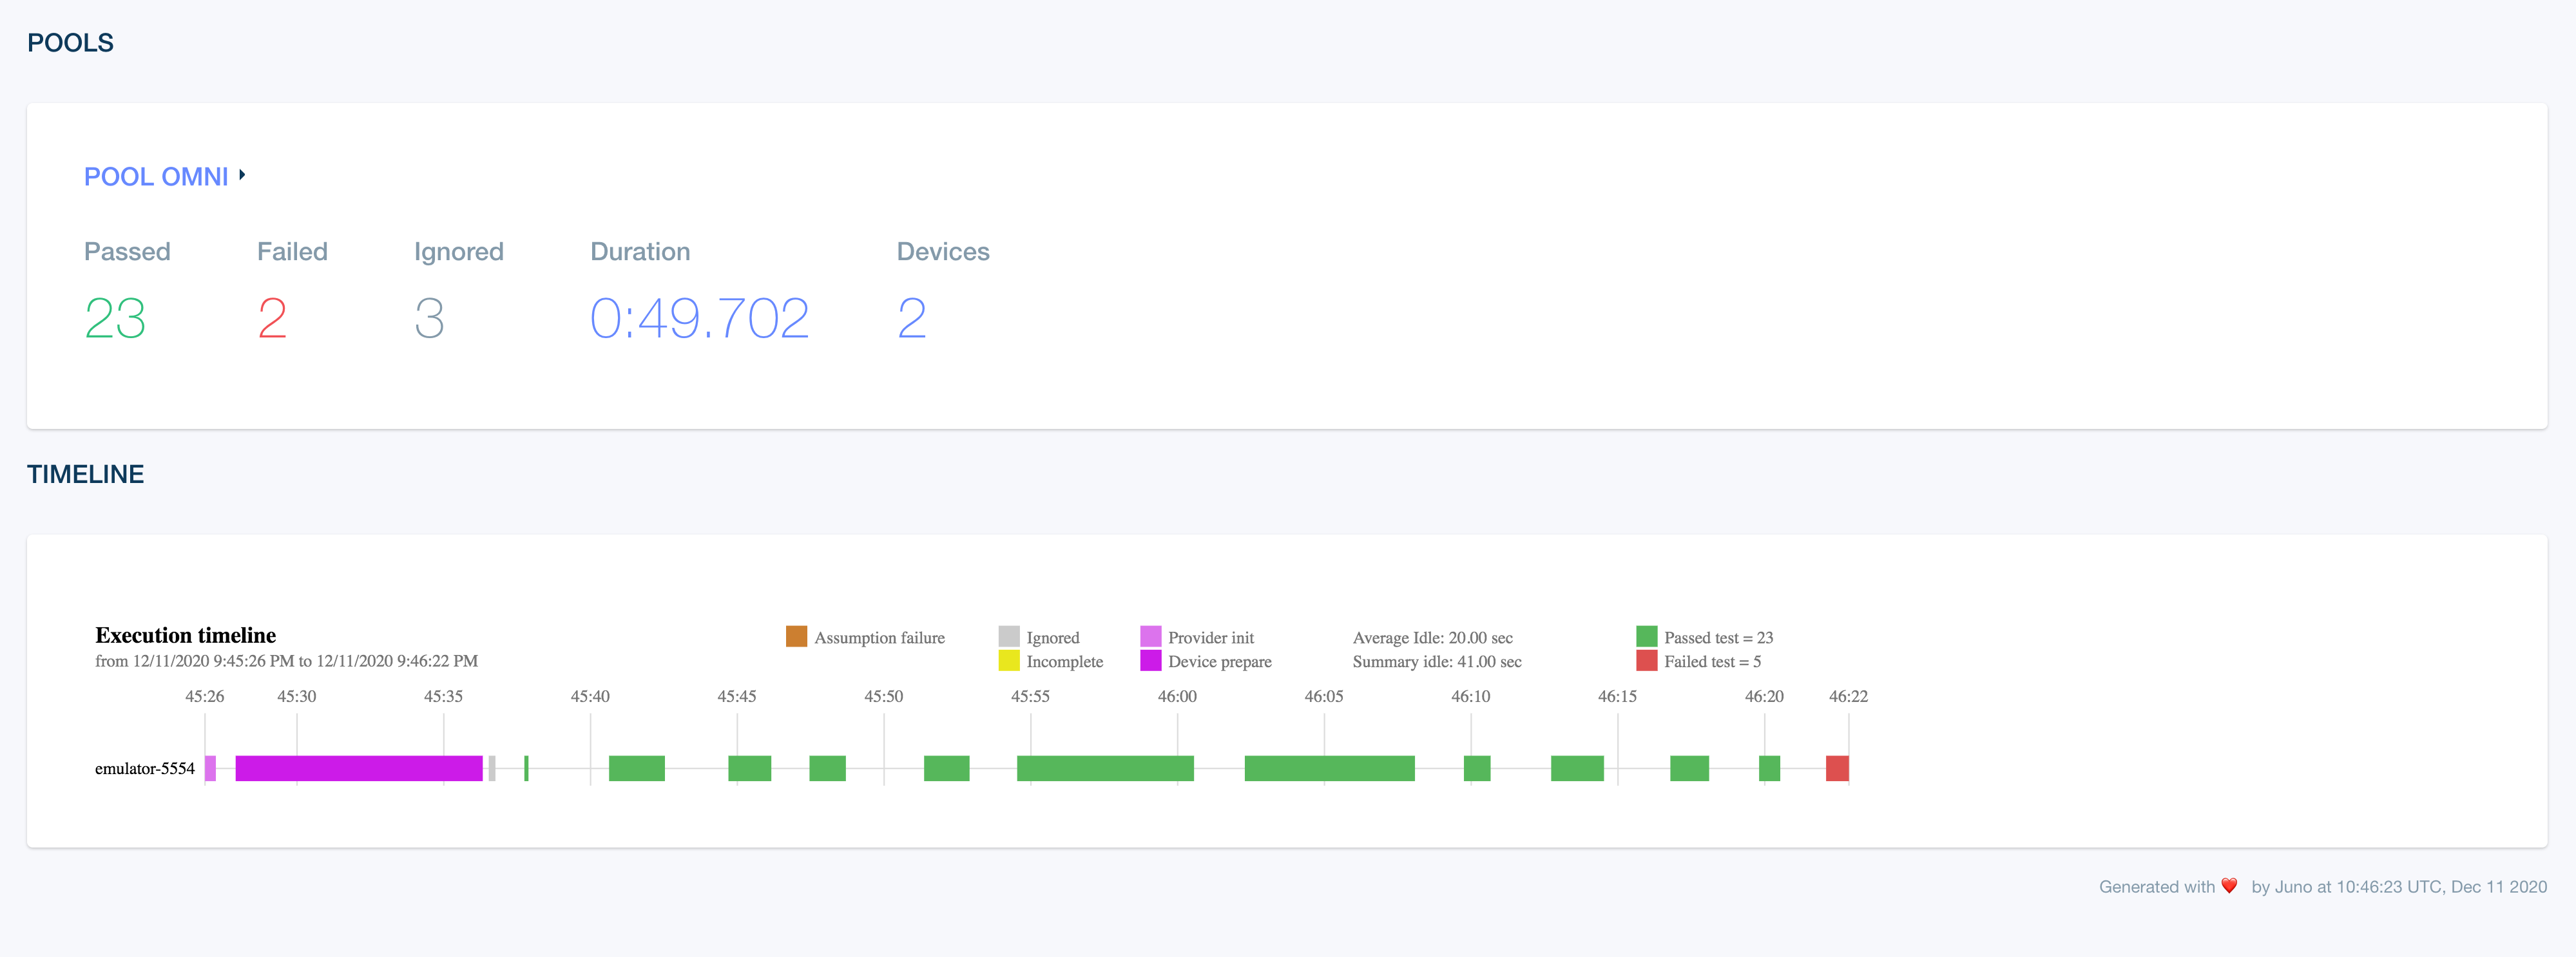
Device pools are separated on the main page of the report:

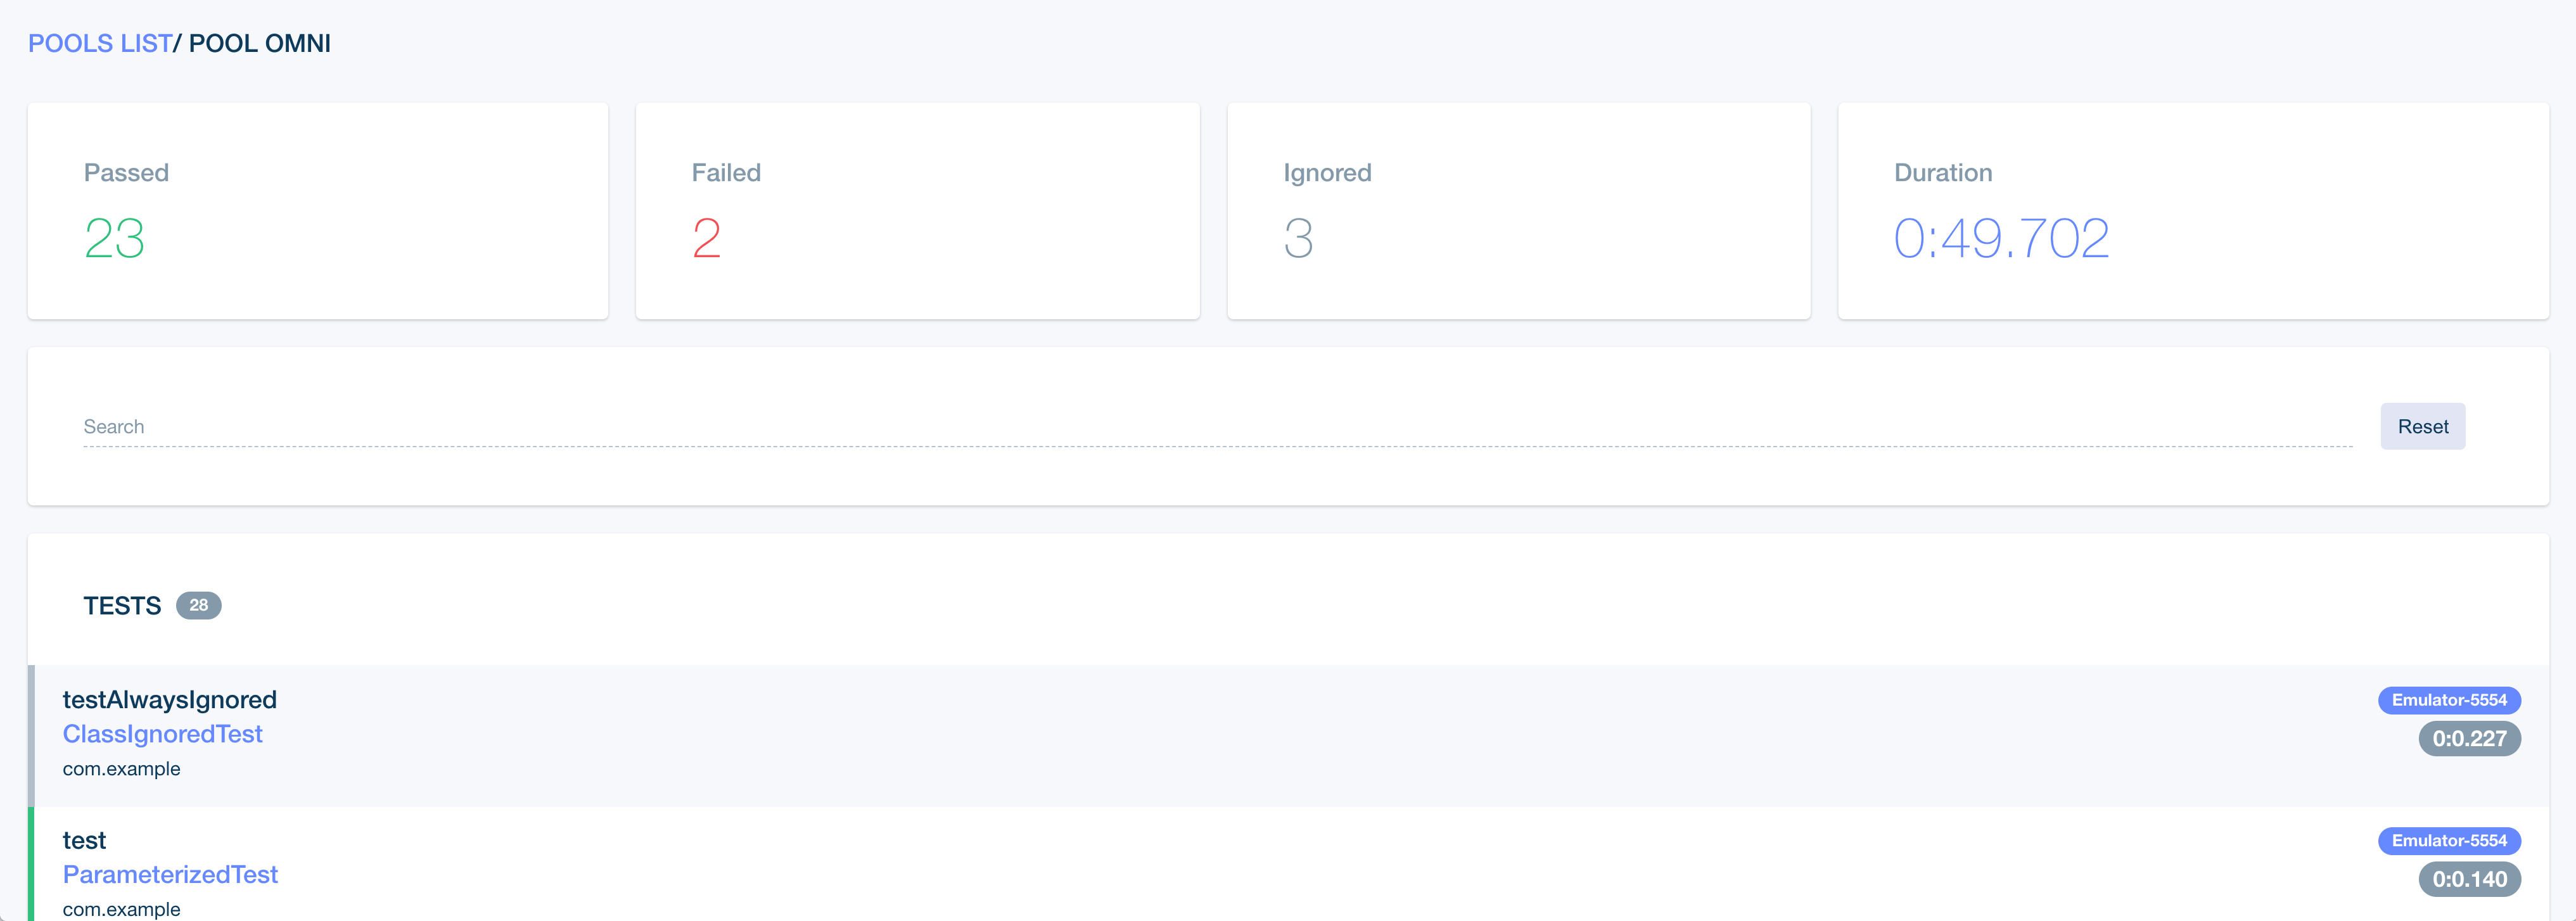
The pool part of the report shows test result (success, failure, ignored), video/screencapture if it's available and also device's log. Filtering by test name and class is supported:

Timeline log
This report is now part of html report but if you need to view it separately it can be found at $output/html/timeline/index.html
Timeline helps identify potential misbehaviours visually helping infrastructure teams identify faulty devices and also helping developers identify tests which affect the whole batch. For example you have a test which doesn't cleanup properly after execution and all the tests after this one will fail in the same batch.

Hovering over a test batch will show you the name of the test.
CI reports
JUnit4 report
Xml files are written according to the Junit4 specification to integrate with existing tools such as Continuous Integration servers or third-party tools such as Danger.
All the reports for respective pools are placed at $output/tests/${poolName}/*.xml.
Allure report
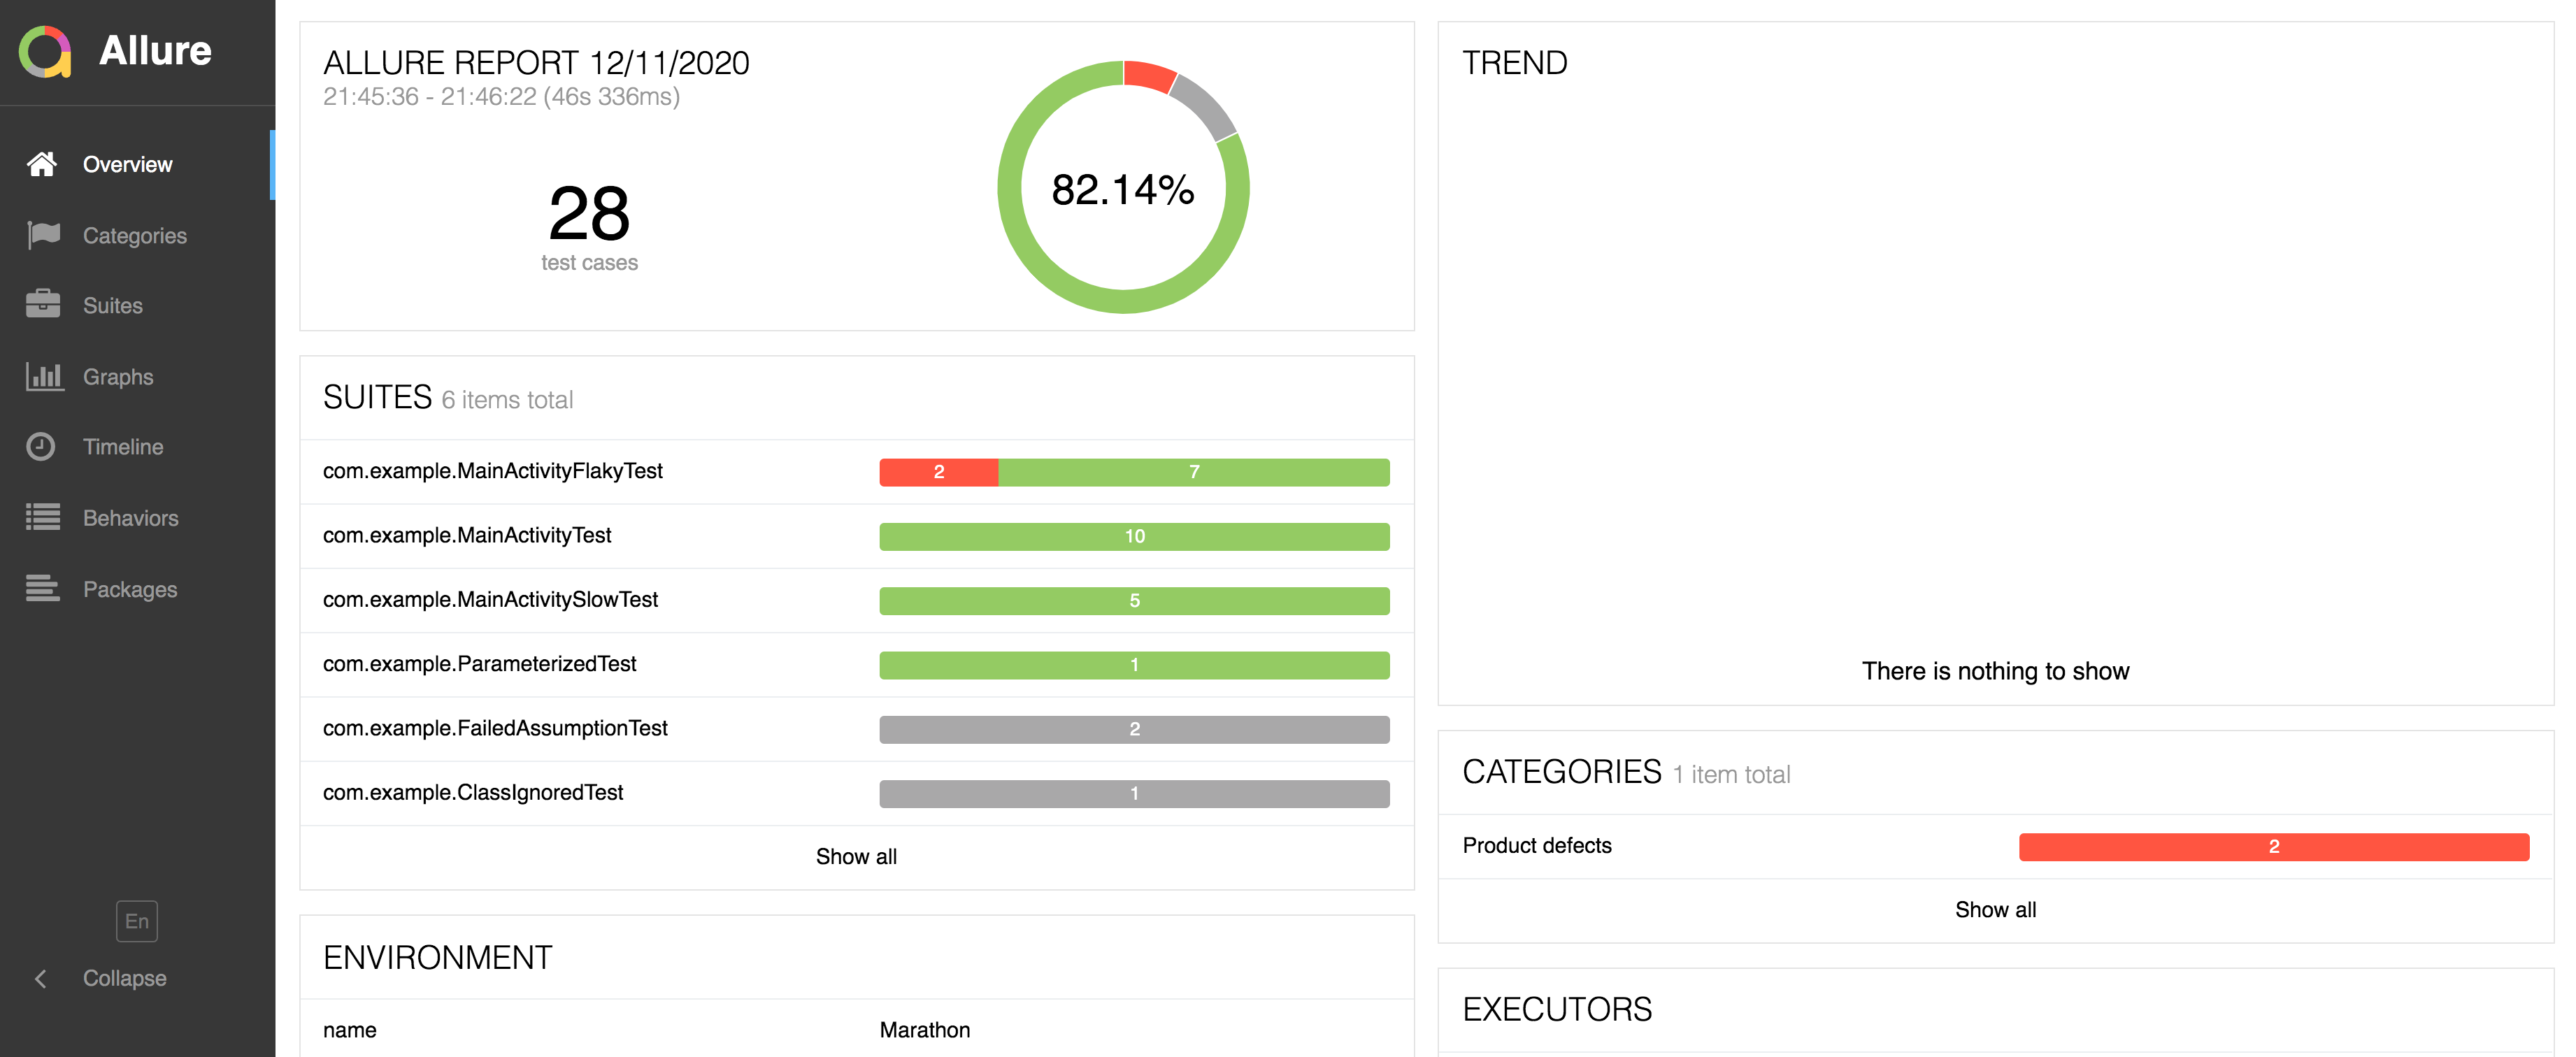
allure report helps identify multiple possible problems during test execution.
Demos:
Marathon generates only the data files for report generation. You can generate the actual allure html report via commands line or plugin options available from allure.

One of the best use cases for this report is the grouping of problems which helps to identify if your tests have a specific issue that is relevant for a large number of tests. Another useful feature is the ability to see all the retries visually and with video/screencapture (if available). Allure also provides the ability to see flaky tests by storing history of the runs.
Allure JSONs can be found at $output/allure-results
If you're generating Allure results in your tests, you can pull those with marathon, but keep in mind that those files are not recognized as inputs for marathon's allure report. They're different views on what happened during testing from the perspective of marathon and from the perspective of test.
Dashboards
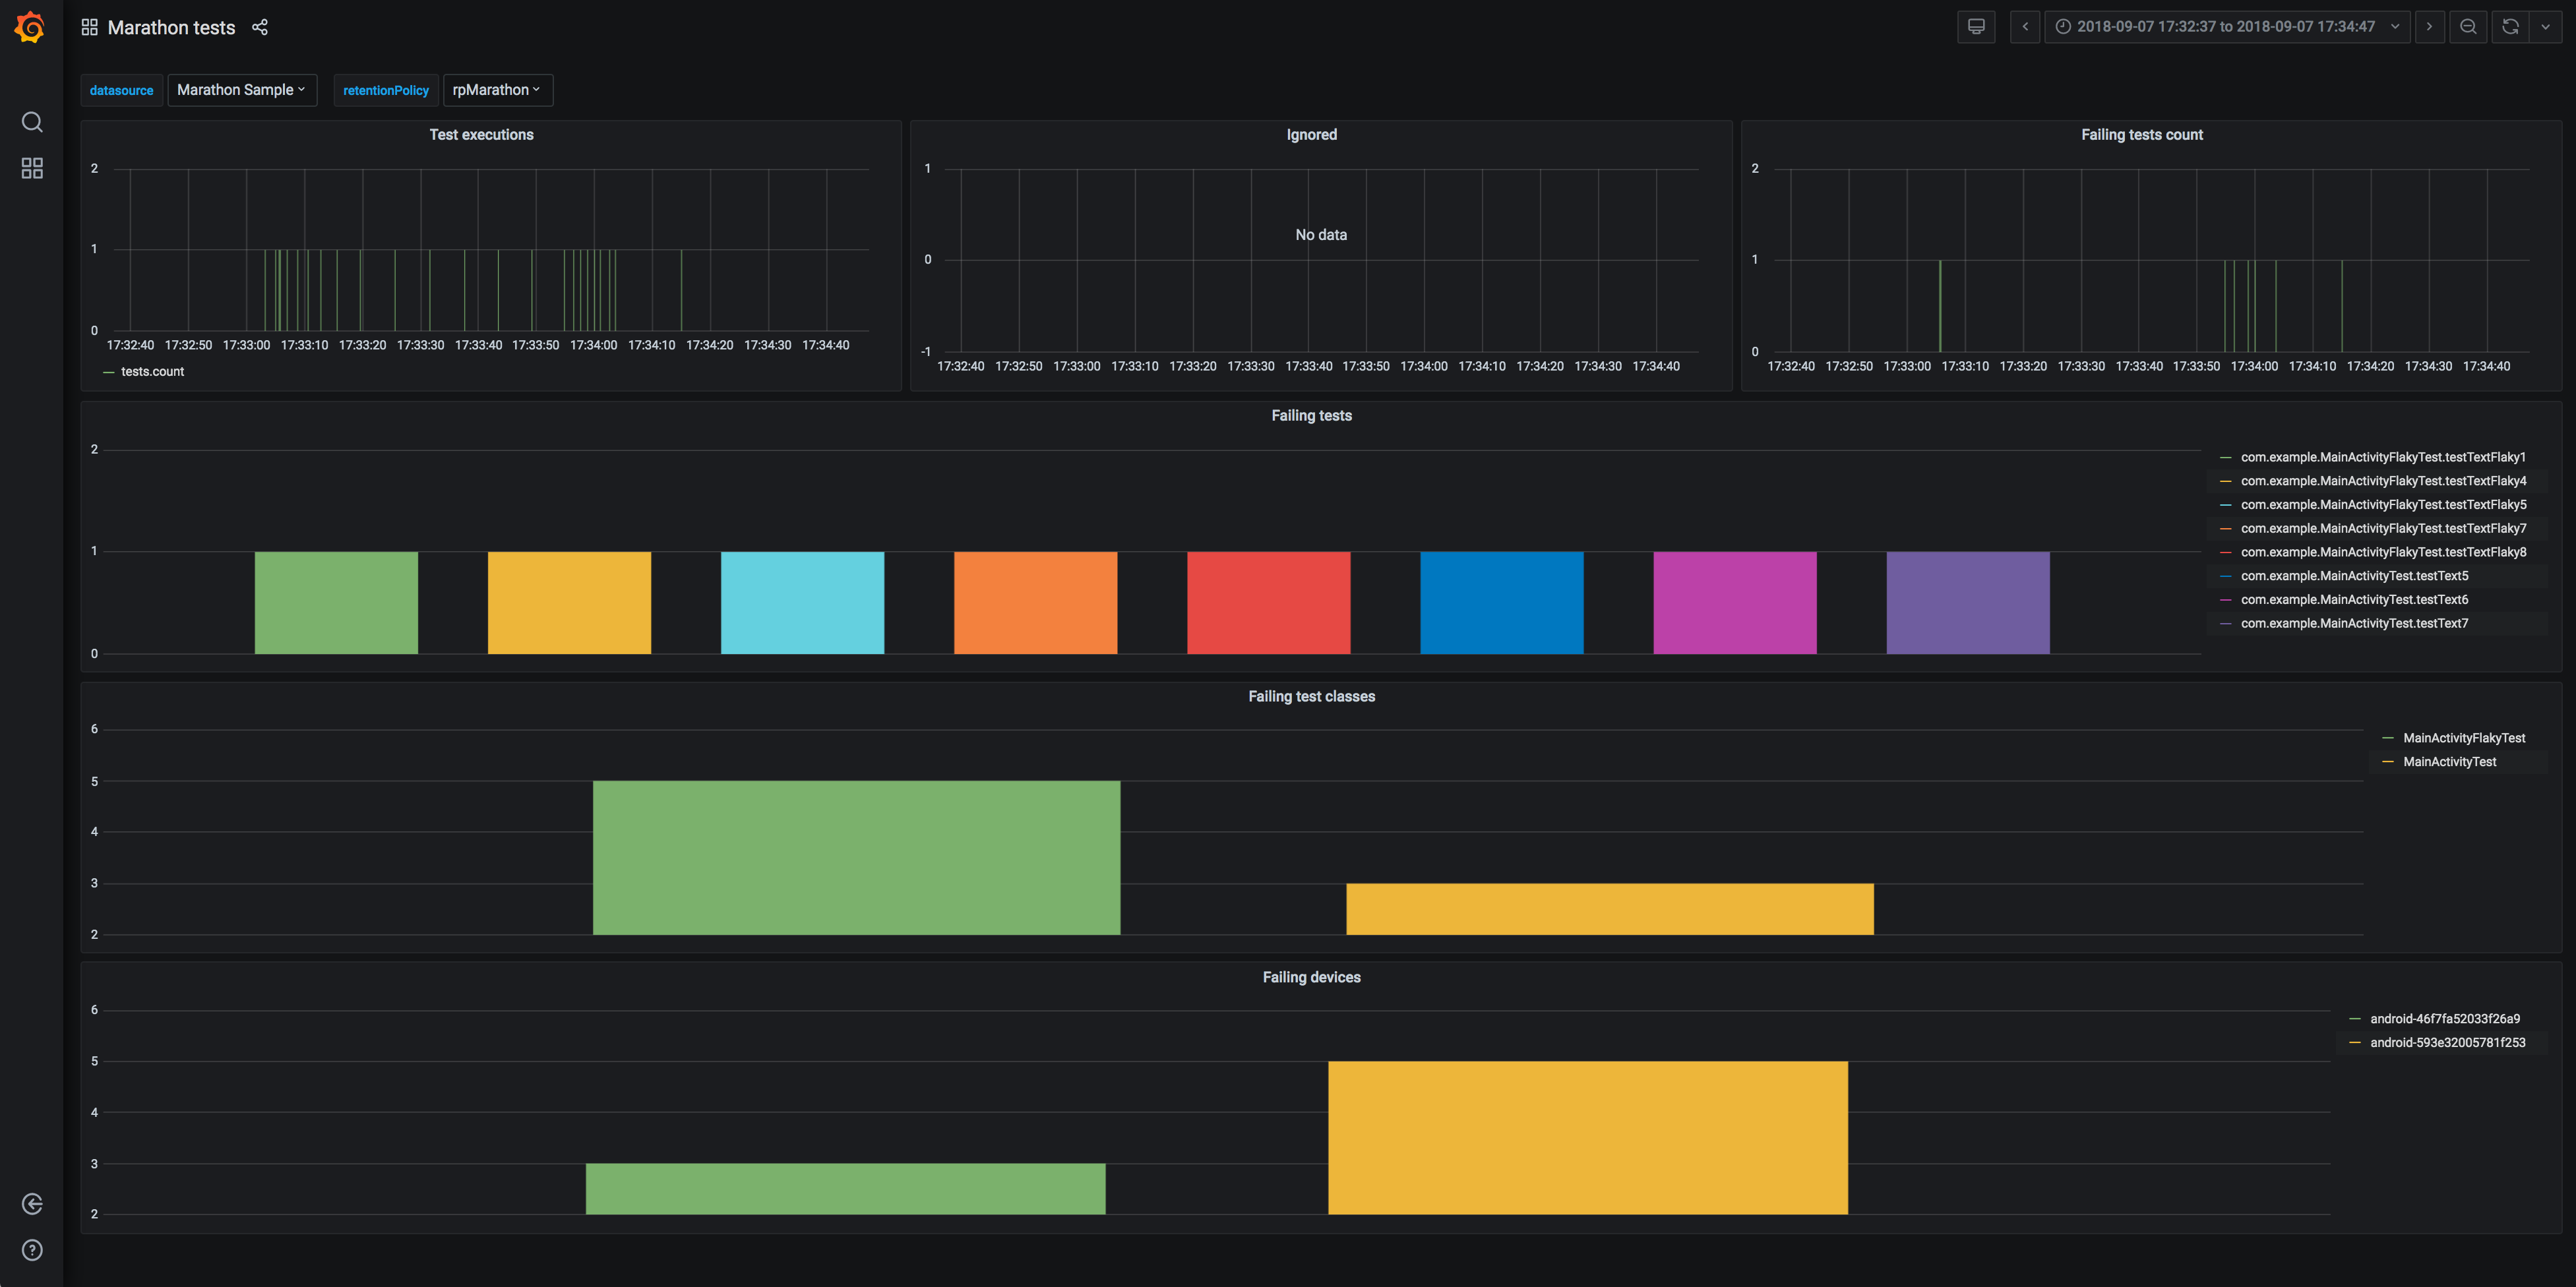
Marathon is able to leverage the power of InfluxDB and Graphite to store and fetch the metrics about the test runs. There are sample dashboards for InfluxDB and Graphite that you can use in Grafana to visualise this information to better understand what's going on.
